
Project
Massive Destruction InfoGraphic Design
Group Member
Huihui Guan, Xinran Kuang, Chen Ma
Duration
Mar. – May. 2018 (5 weeks)
My Role
Concept, Visual, Group
Project Brief and Target Audience
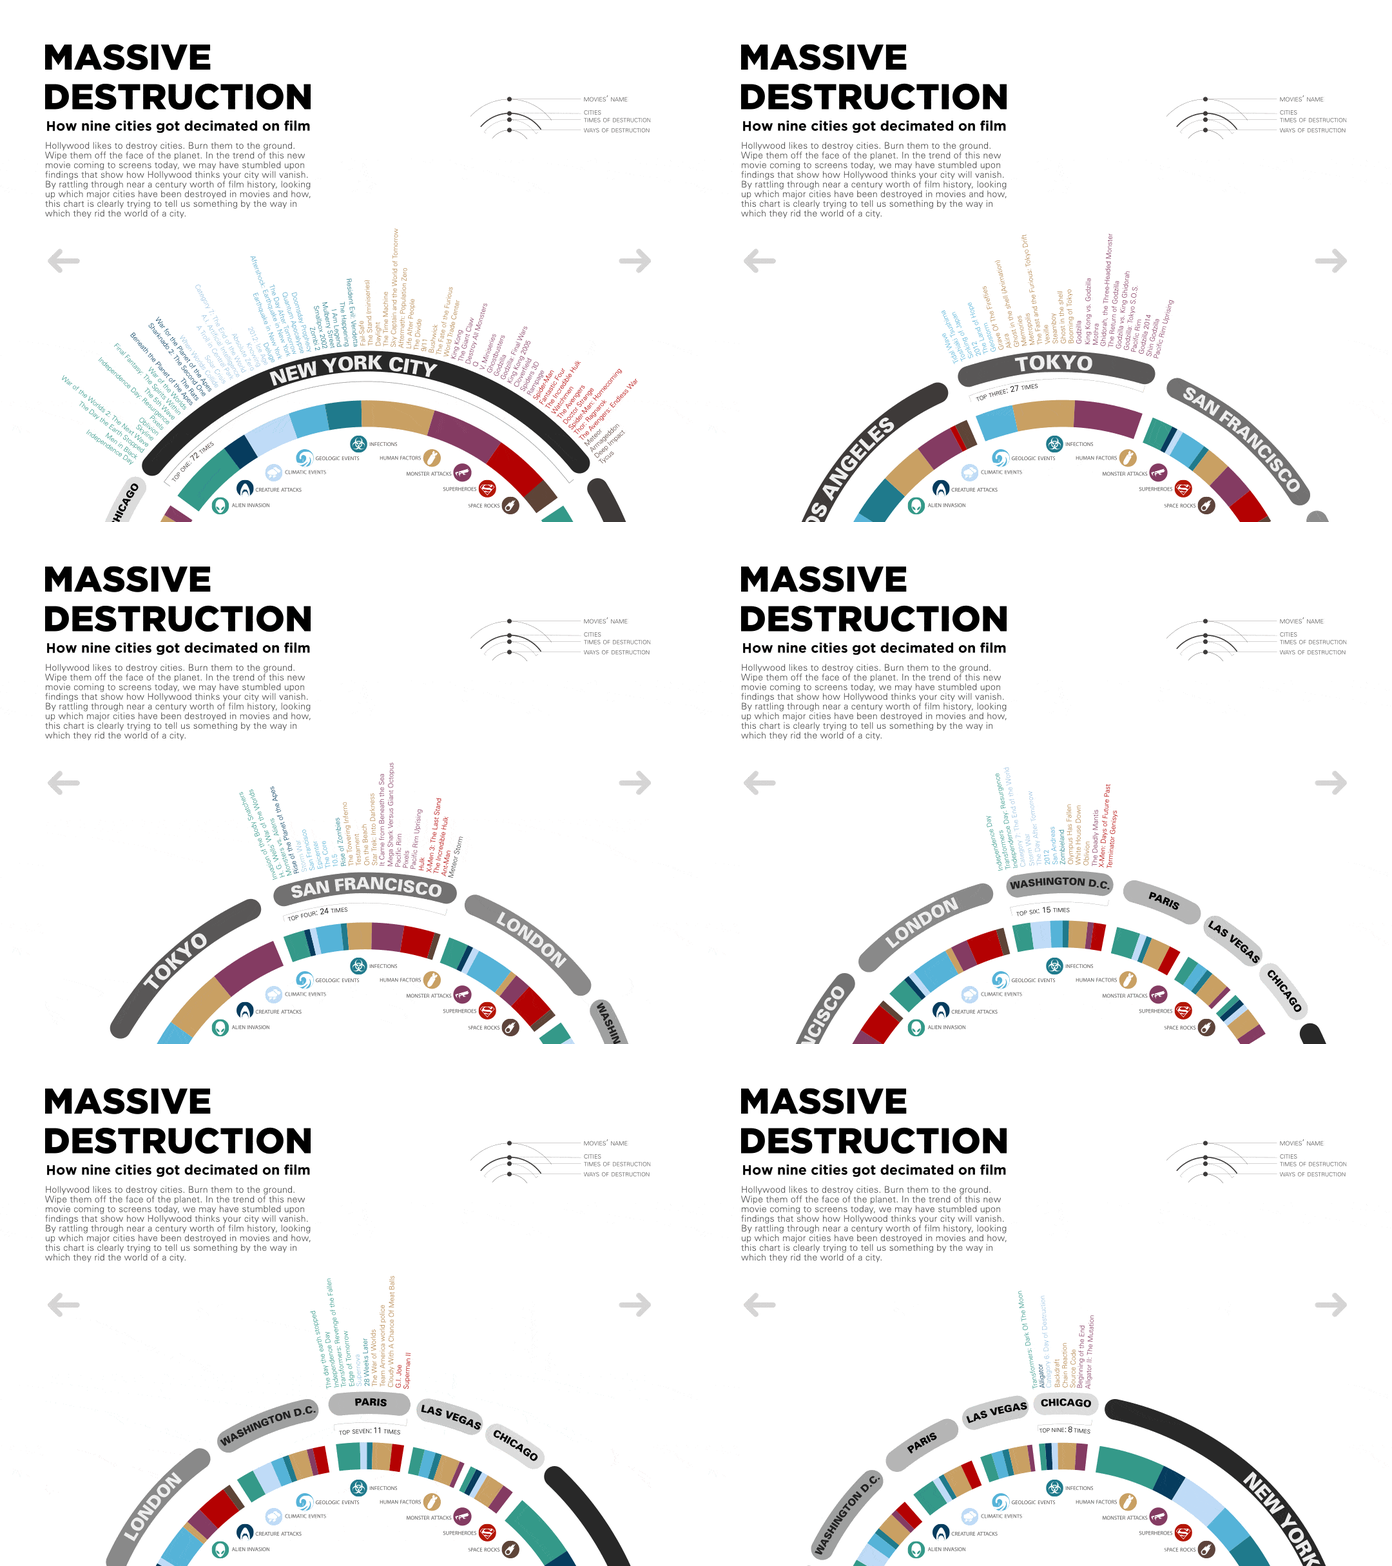
This group project is based on the summary statistics for cities have destroyed in movies (by the middle of 2018) to accomplish an infographic design. We‘ve had in-depth research in a different kind of films and analyze the data into nine ways of destruction. The target audience is moviegoers. The original infographic design is for The New York Times newspaper movie section. The final design solution is to create an interactive kiosk screen at the video store where the target audience can view and encourage them to purchase.
Project Description
Hollywood likes to destroy cities. Burn them to the ground. Wipe them off the face of the planet. In the trend of this new movie coming to screens today, we may have stumbled upon findings that show how Hollywood thinks your city will vanish. By rattling through near a century worth of film history, looking up which major cities have been destroyed in movies and how, this chart is clearly trying to tell us something by the way in which they rid the world of a city.
Research
We created an excel form to start with this project, then we did the research based on the plot of the movies and picked nine cities that have been destroyed the most of the times, these cities are New York, LA, San Francisco, Tokyo, DC, Paris, Chicago, London, and Las Vegas. Then we defined the nine ways of destruction, such as Monster Attacks, Mankind, Infection, Superheroes, Climate Events, Creature Attacks, Allien Invasion, Geologic Events, and Space Rocks. After that, we added the movies' release year, box office, and movie category.


Sketches


As we are moving forward, we decide to use the round chart to show how the cities have destroyed in films. But the one on the bottom left side only shows the number of destructions, it doesn't carry enough information for formal infographic design.
The icon design for ways of destruction has settled as the bottom right.

Mockups


Digital Kiosk
To further extend the project, since it is an infographic design for the movies, the best solution should be digital, so I choose a kiosk screen format. In the kiosk format, I scale the main chart to get better legibility. Then I add a video to better explain how the nine cities have destroyed.


Previous Project
Financial Gossip Girl App
Previous Project
Next Project
91 Financial Service App
Next Project
